Using tables intentionally and with proper formatting is crucial for ensuring accessibility with screen readers and other assistive technologies. Here are some best practices to keep in mind when incorporating tables on web pages and documents.
Best practices
- Use tables only for true tabular data.
- Use simple tables; complex tables can be split into multiple simple tables.
- Identify tables by captions or headings that are separate from the table content.
- Provide summaries and takeaways in the surrounding text.
- Have single column and/or single row meaningful and unique headings.
- Do not leave blank cells.
Assign header rows
- Add clear and descriptive header rows to help screen readers accurately understand table data.
- Header rows provide users with meaningful context, improving the overall understanding of the content within the table.
- Header rows must be set in the table’s settings of your software.

Keep table structure simple
Whenever possible, keep your table structure simple. Avoid creating tables with:
- Multiple levels of rows or column headers
- Headers that span just some rows or columns
The above scenarios create a complicated scope for each table cell that is difficult to make fully accessible.
Alternatives to complex tables
- Break up the data into multiple tables.
- Combine your header labels to where they logically fit in one row
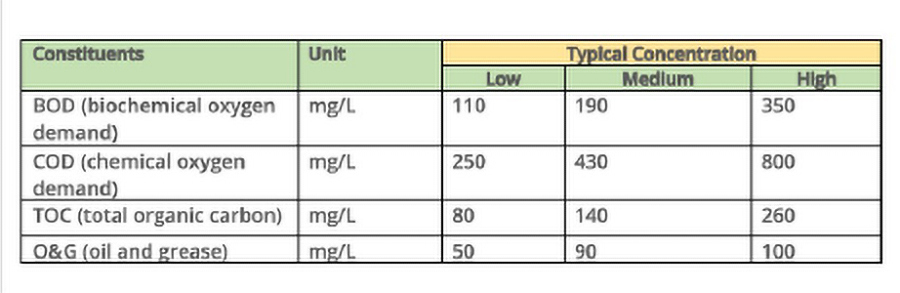
In the example below, the yellow cell is an extra, separate header that makes the table structure more complex. Avoid complex header structures that include merged, split or nested cells when possible.
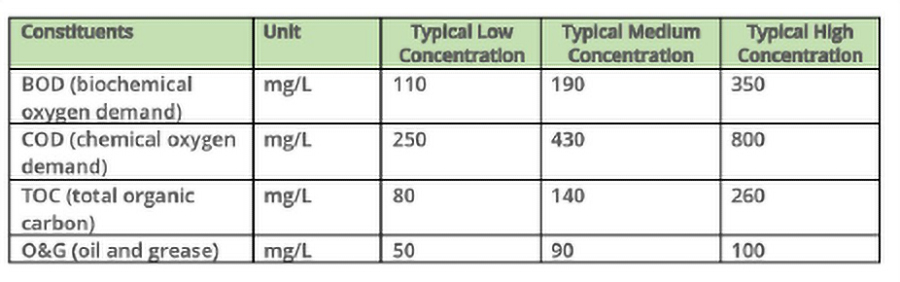
Instead, do something like this. Here the header labels are simplified into one row, and still convey the same information.
Use tables to make chart data accessible
Charts and graphs are inherently visual and may not be fully accessible to screen readers, so including the same data in a table provides an equivalent, text-based alternative. This allows users to navigate and understand the data in a structured way, ensuring the information is accessible beyond the visual presentation.
Learn more about making complex images accessible.
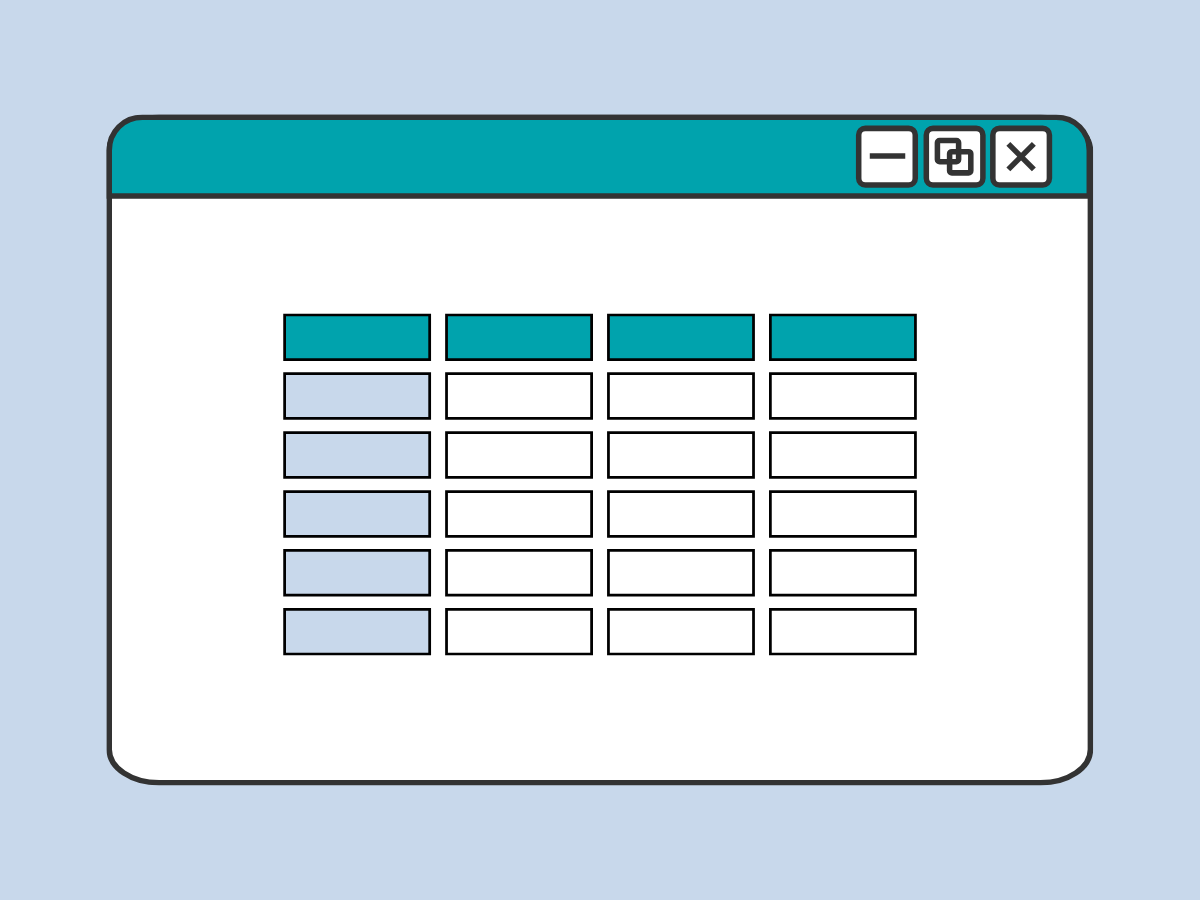
Use tables for data, NOT page layout
- Only use tables for presenting structured data, such as statistics.
- DO NOT use tables simply to arrange visual page layout.