The Office of Information Technology is now providing monthly analytics reports using a product called Siteimprove. These new reports are easy to read and make it simple to analyze your website statistics. View a sample county report.
Here is what is included in each report:
Metrics bar. The metrics bar gives you a snapshot of statistics for the current month, including visits, views, visitors, and bounce rate. You’ll also see percentage increase (+) or decrease (-) compared to the previous month. Since terms like “Bounce Rate” can be hard to understand, a glossary of terms is provided on the last page of your report.

Tips to understanding these statistics:
- The number of “unique visitors” tallies the number of individuals who visited your site during the last month, no matter how many times they visited. For instance, if person A visits your site six times and person B visits twice, you have two unique visitors with a total of eight visits. Unique visitors is important because it represents the size of the audience you are reaching with your website.
- Want to know how engaged your audience is? The ratio of unique visitors to total number of visits can tell you. If you have twice the number of visits as visitors, you’re doing fine.
- Look at your number of returning visitors. If the number of returning visitors is growing, that means people have found your website to be useful and are coming back for more information.
- Bounce rate can tell you how engaged your visitors are. But it’s tricky!
- If you expect your users to browse around your site from page to page, your bounce rates should be below 50%. This will indicate that your users are coming to your site and staying.
- But higher bounce rates can be okay if you expect users to get what they want and then leave. Some of the most popular Extension publications have bounce rates close to 90%! We hope it’s because our users found what they were looking for.
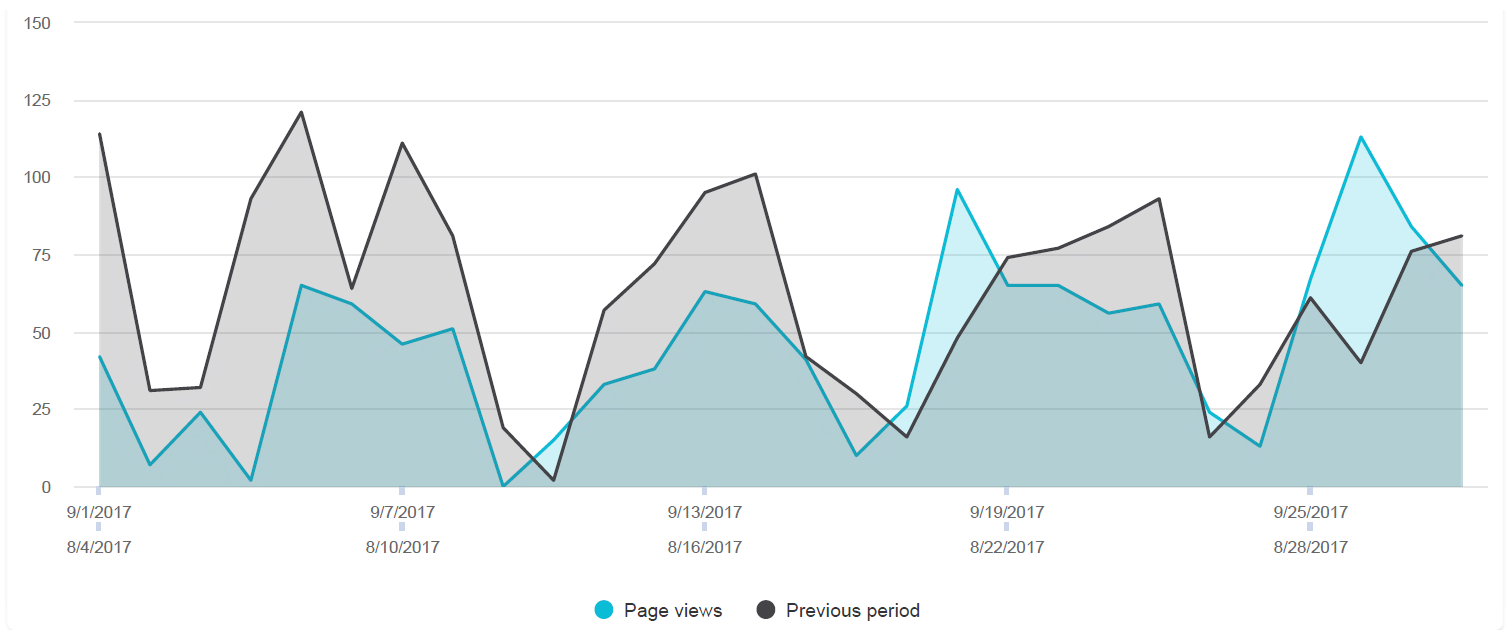
Graphs for visits and page views. The graphs give you a visual look at visit and page views patterns for the current and previous month. As you analyze the graphs, look for consistencies. Are there specific days of the week with the most visitors? Try to release new information on your site with these days in mind in order to reach the most visitors.
Visitor summary. An overview of the most frequently used device, operating system, browser and screen resolution, as well as the country that uses your site most. A detailed list of countries and devices is included.

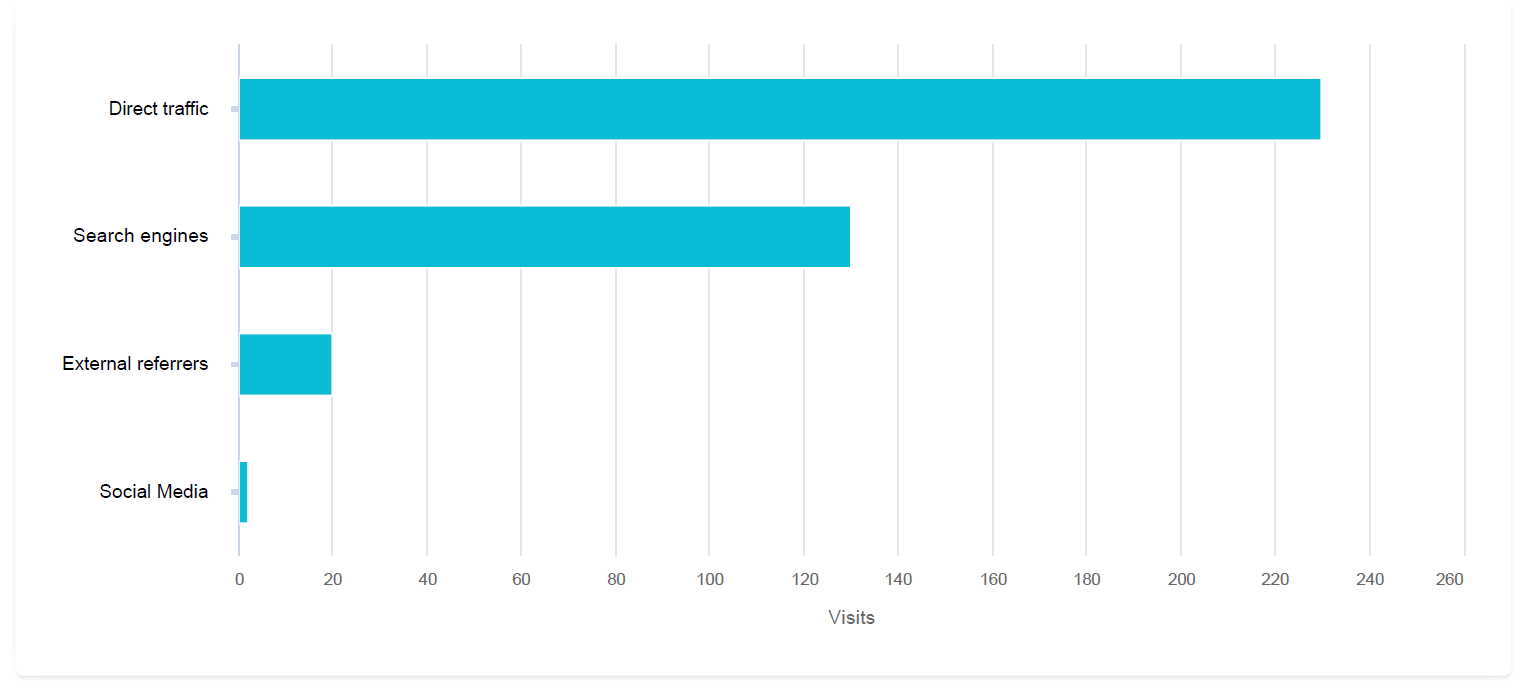
Traffic sources. This bar graph lets you know where your traffic originates. Have your visitors bookmarked your site (direct traffic), finding you through a search engine or from an external website, or are they linking from social media? Understanding where your traffic comes from is key to understanding if your marketing efforts are paying off.
External referring domains. A list of website domains that link to your pages and a total number of visitors who are using those links. Use this list to determine exactly where people are linking to your website from and then strive to promote your website’s link even more from those specific sites.
External search terms. A list of search terms used across all search engines. If you see that visitors are looking for specific keywords, then be sure to use that terminology on the appropriate web page and provide related content that the visitor will find valuable.
Entry pages. A list of the pages visitors come to when they first enter your website. These may be considered “landing” pages. Be sure your visitors can find what they need on this page even if they never visit another page of your site.
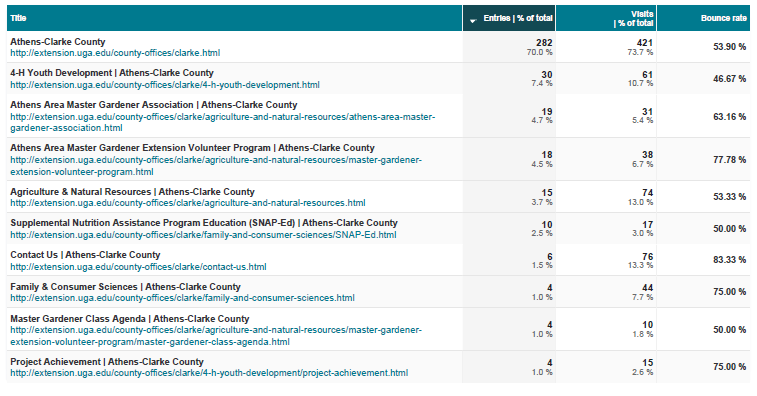
Most popular pages. A list of your most visited web pages. It is valuable to use this list when updating or making corrections to your site. Be especially vigilant in keeping your most viewed pages accurate! Use your quality assurance report to correct broken links or misspellings. Here’s more information on how to use the QA report.
Behavior tracking. This sections provides an overview of how visitors reach your most popular web page and where they go next. Does the visit end or does the visitor link to other pages on your website? Learning how people interact with your website will help you make smarter choices to maximize your site’s value.
![]()
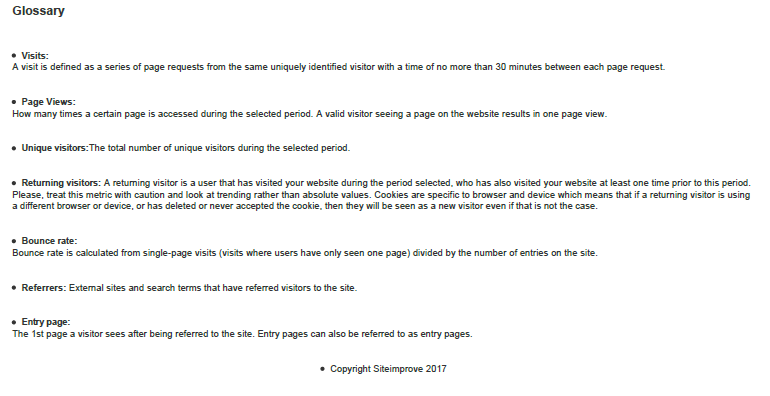
Glossary. The glossary provides definitions specific to terms used in the analytics report.